My November 2026 Action Plan
My semiconductor puts are closed. The market now reminds me of 2022, which was heavy, choppy, and full of rallies that faded. So my November plan is about patience on QQQ, being picky inside the strong sectors, and getting paid for high volatility instead of fighting it.
1. The semis puts are closed
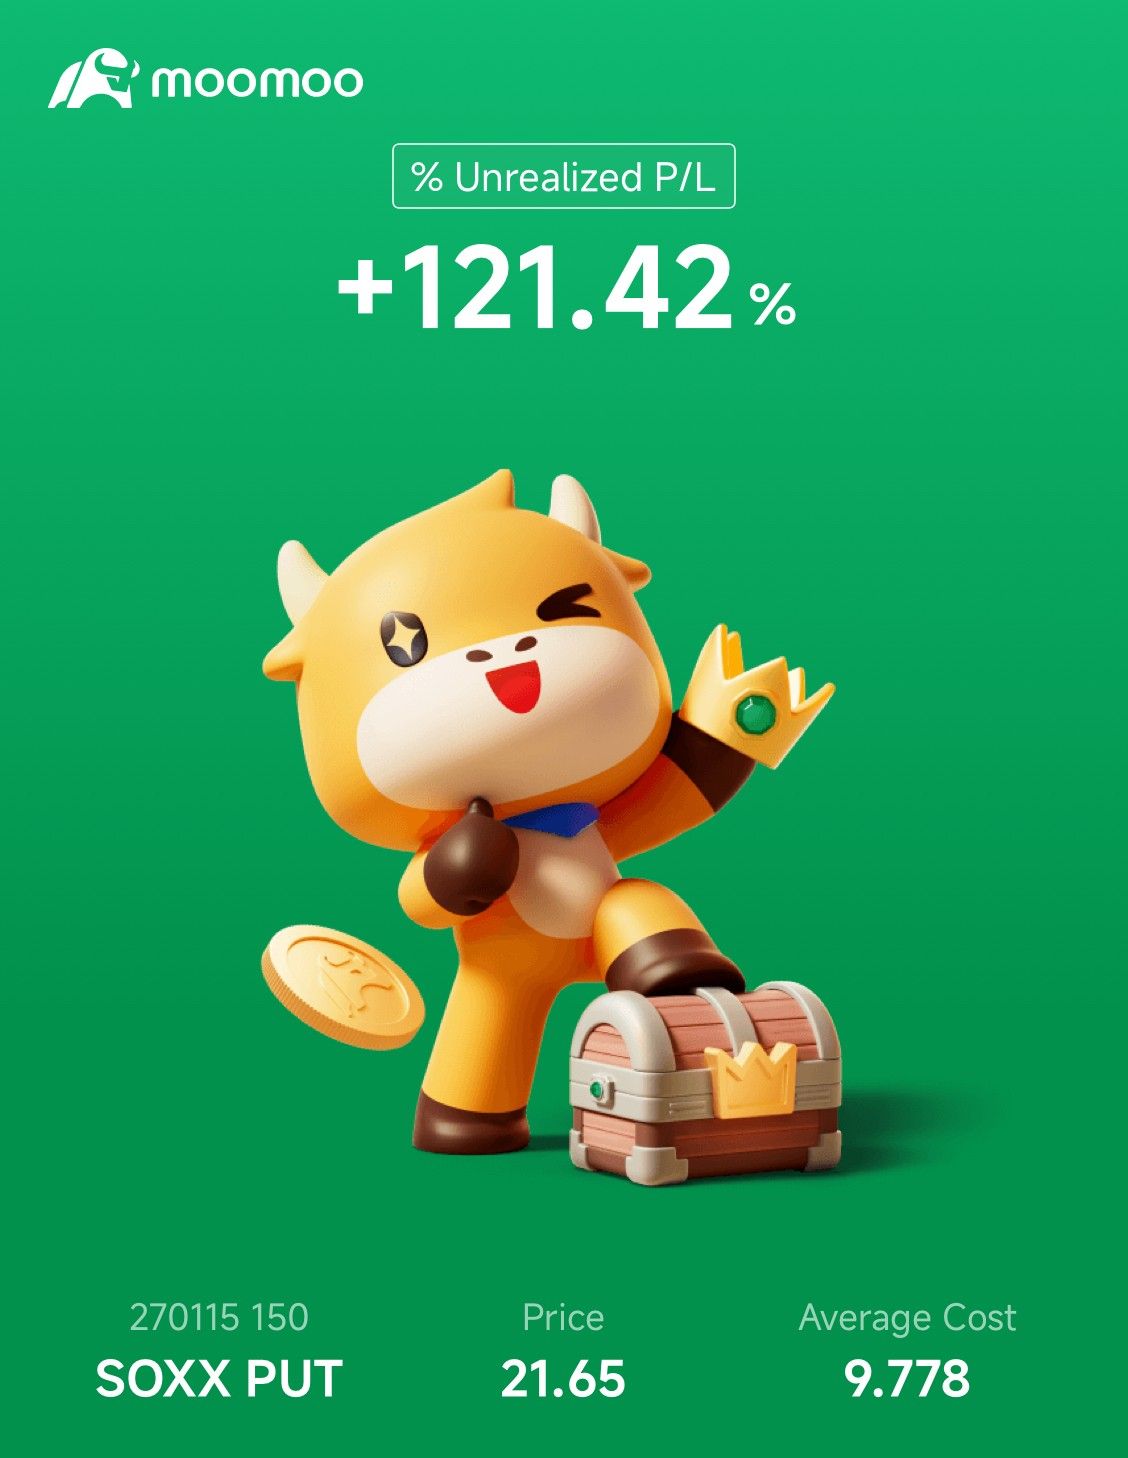
My SOXX put, Jan 2027 $150 strike. Average cost $9.78, priced at $21.65 when I took this, just before I closed it.
Going into the semis rally in late October, I personally thought the price action was weak and not constructive off the 200-day bounce. The reclaim came on weak volume, and every earnings report got sold. So I bought puts on SOXX and EWY (the Korea ETF, which is heavy in chipmakers) to hedge my overall exposure to the market, and took profit (TP) into the capitulation on 5 November.
That day was violent. SOXX fell 12.1%, EWY fell 13.5% and QQQ fell 6.5%, worse than any single day of the April 2025 tariff crash. The VIX closed at 28.18.
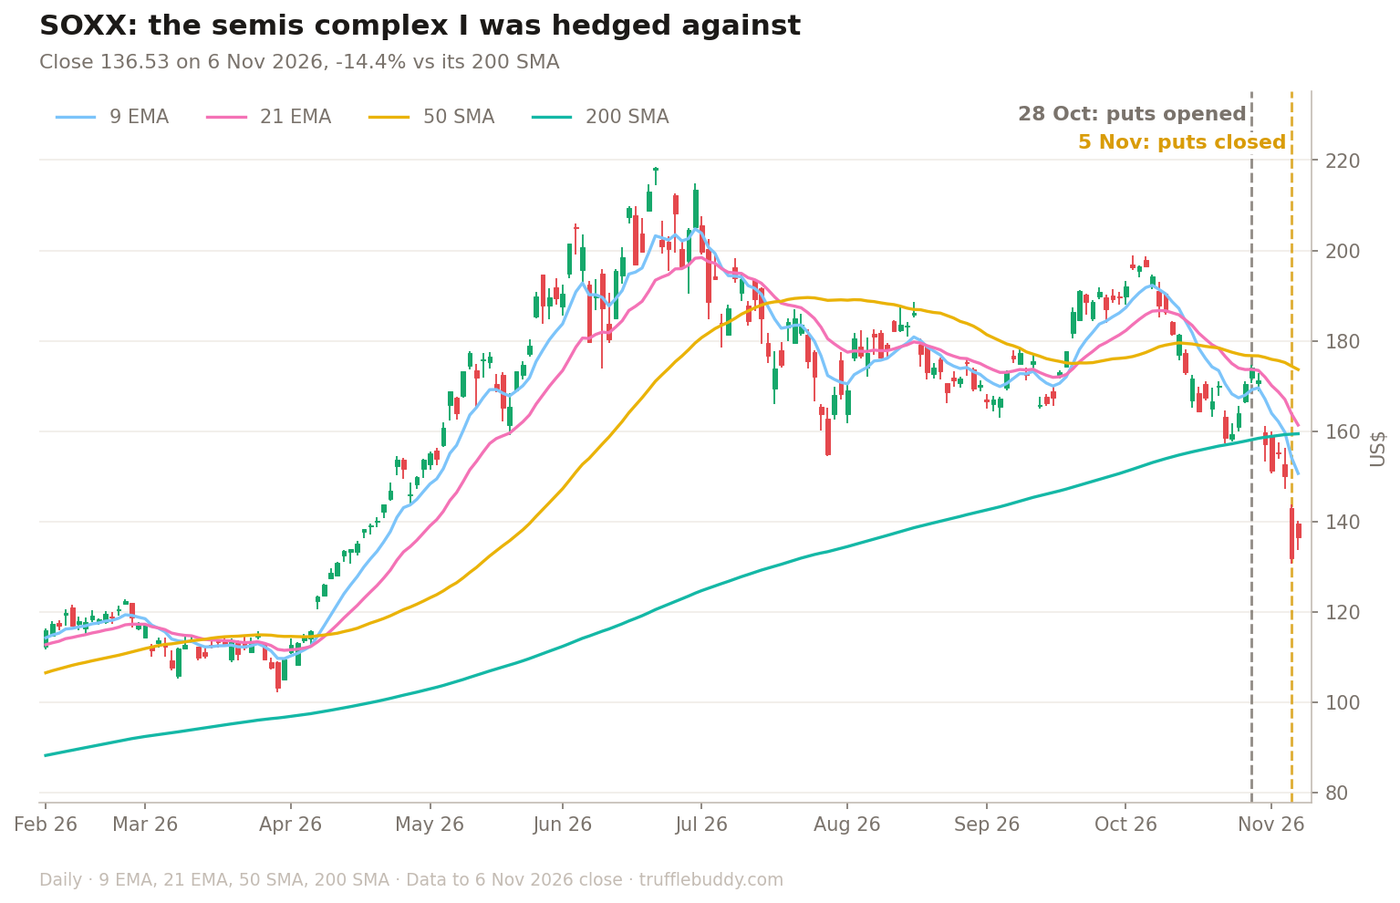
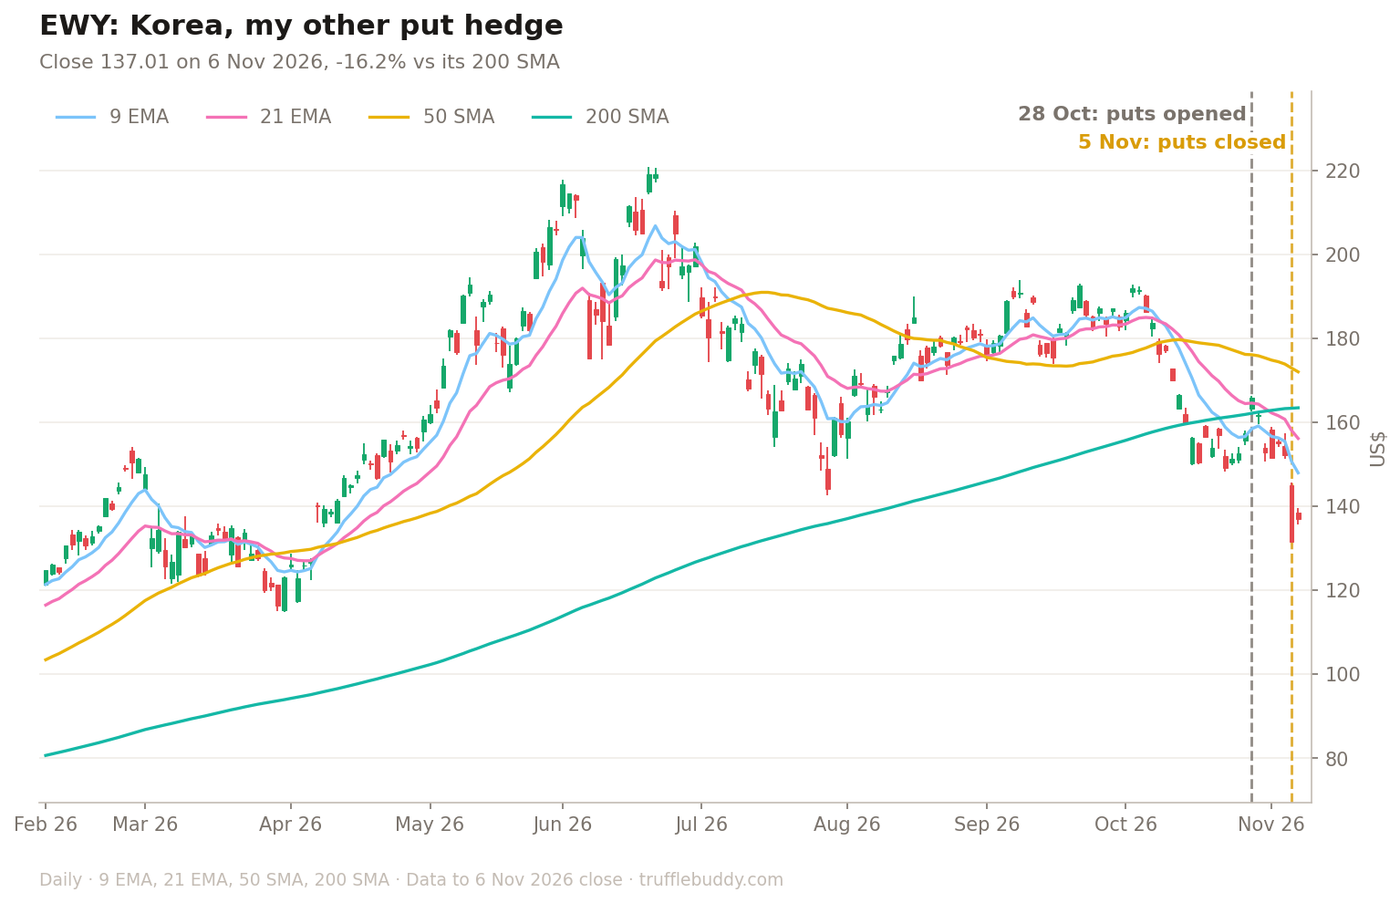
I did not close because I thought the move was finished. I closed because volatility was spiking, with the VIX at a 28 handle on the day, and I wanted to monetise the high premium in my puts before it faded.
Going forward, I think high volatility makes shorting this market a difficult job, because puts are now expensive: on 6 November the VIX closed higher than on 95% of trading days in the past year.
Which is why, going forward, my plan mainly focuses on using that elevated volatility as an edge, and keeping cash ready to deploy into deep capitulations.
2. Why this feels like 2022
I am not saying 2026 is 2022. But 2022 is the closest map I have for the kind of market I think we are in: rate headwinds, and tech leading the way down. This time the Fed is weighing a hike in December while an oil shock from the Iran war keeps inflation sticky.
What 2022 taught me is about the path, not the destination. QQQ finished 2022 down 33%, but it got there through three sharp rallies that each looked like the bottom:
| 2022 rally in QQQ | Gain | What happened next |
|---|---|---|
| 14 Mar to 29 Mar | +16.8% | New lows by May |
| 16 Jun to 15 Aug | +23.0% | New lows by October |
| 3 Nov to 1 Dec | +12.8% | Faded into year end |
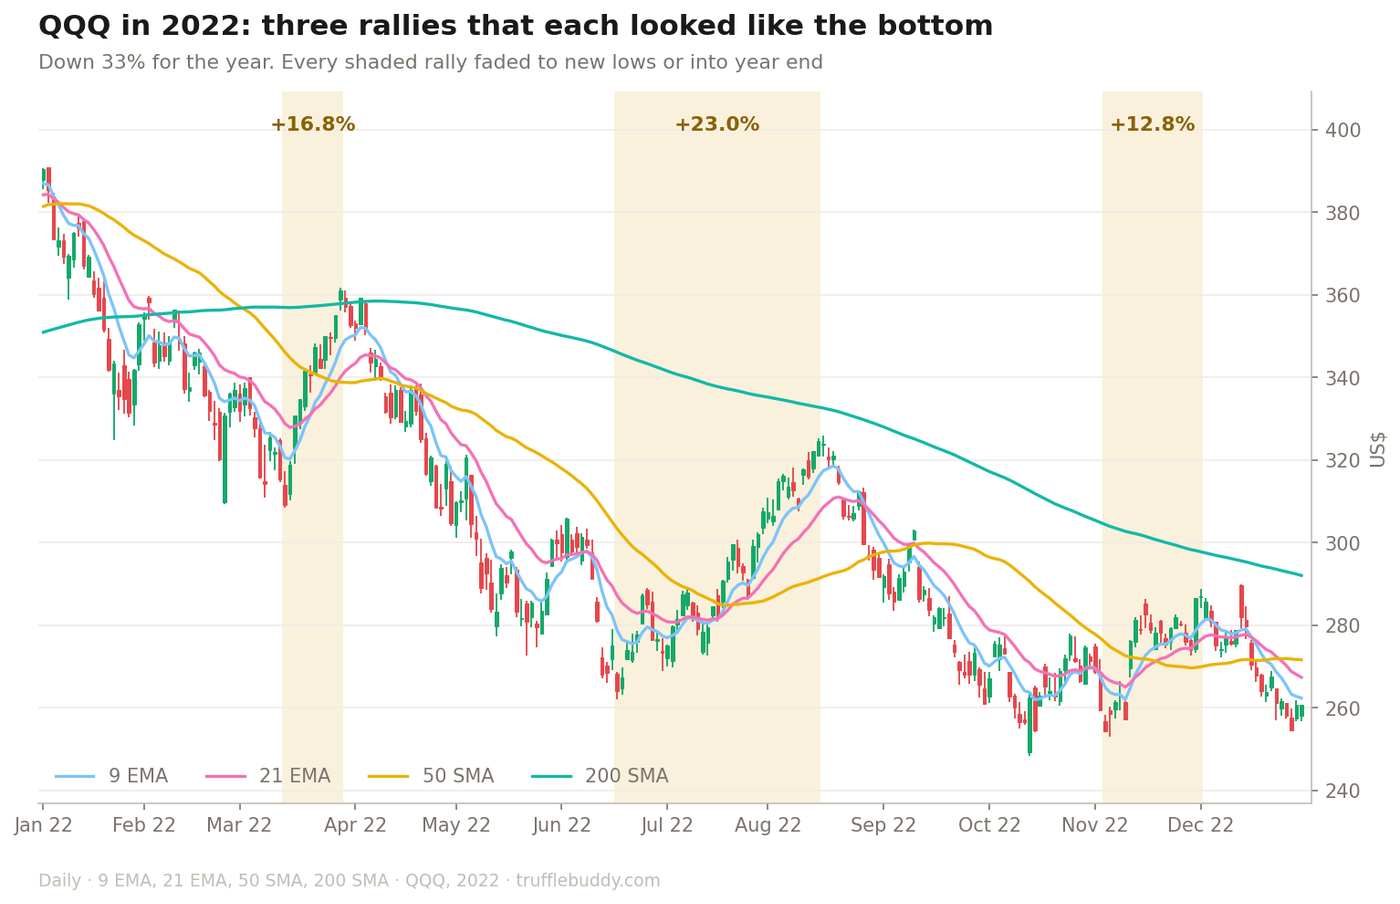
That is the choppiness I am planning for: big swings both ways, and rallies that punish anyone shorting at the lows and anyone chasing at the highs. It is why my plan below leans on selling volatility and defined structures rather than big directional bets.
3. What the Terminal's Rotation tab showed this quarter
This is where the Truffle Terminal's Rotation tab came in. It plots each sector ETF against the S&P 500, so you can see which ones are gaining ground and which are losing it. As of the 4 November scan:
| Sector | Rotation quadrant | Weeks in a row | Quarter to date |
|---|---|---|---|
| XLV, Healthcare | Leading | 4 | +9.7% |
| XLF, Financials | Leading | 3 | +7.0% |
| SMH, Semis | Lagging | 4 | -23.8% |
| IGV, Software | Lagging | 2 | -7.1% |
The Terminal shows where momentum is. It does not say whether a sector is a good buy.
So the same split as 2022 is showing up again: healthcare and financials gaining on the market while semis and software lose ground. In Q4 2022, XLV rose 12.6% and XLF 13.4% while QQQ went nowhere (-0.1%). SMH also rose 10.9% in that quarter, and sector leadership in 2022 did not carry forward reliably. Leaders turn over fast, so the analog does not say who leads next.
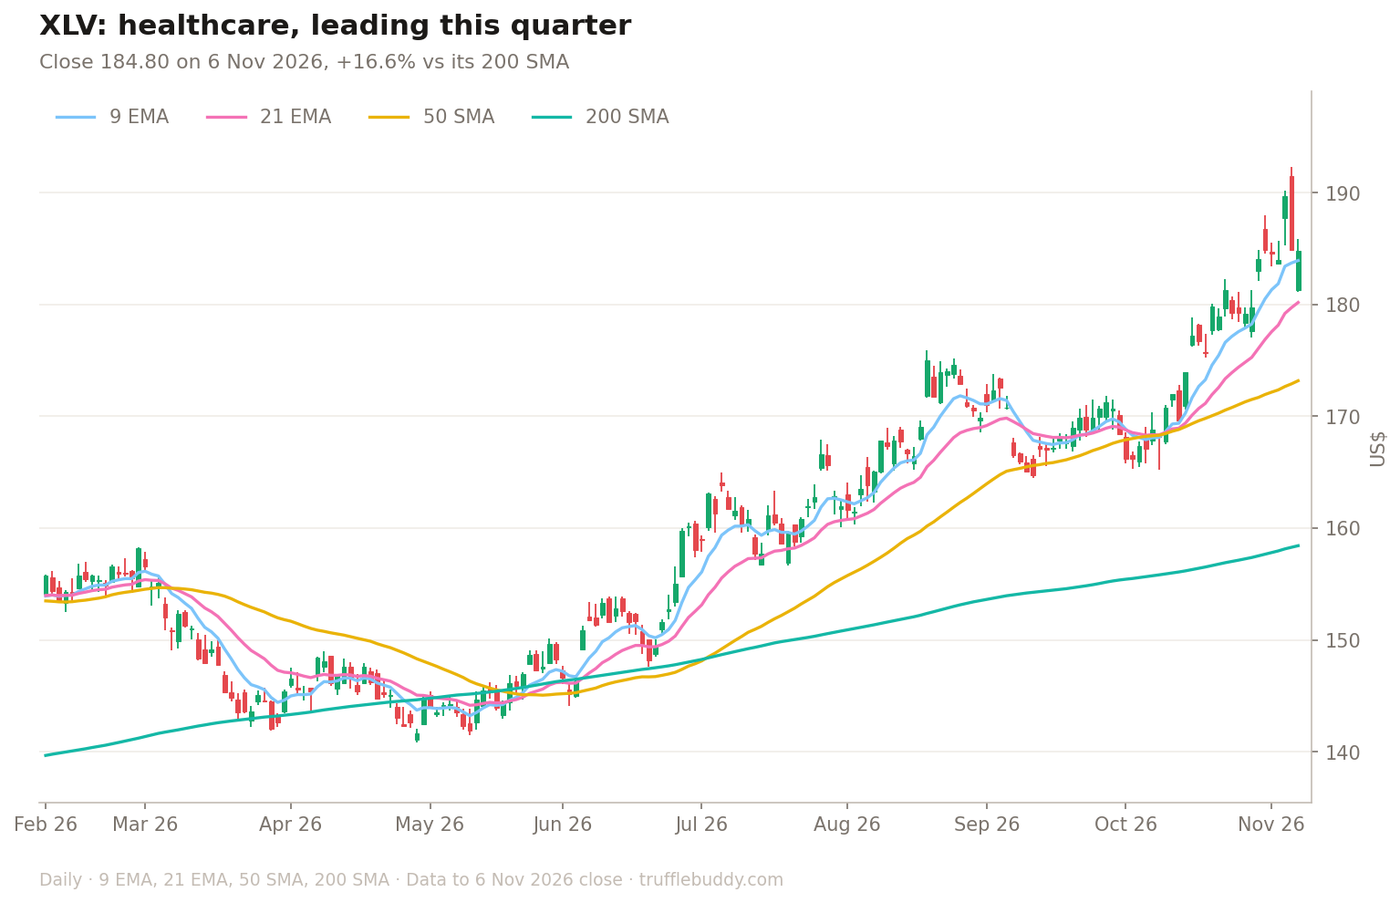
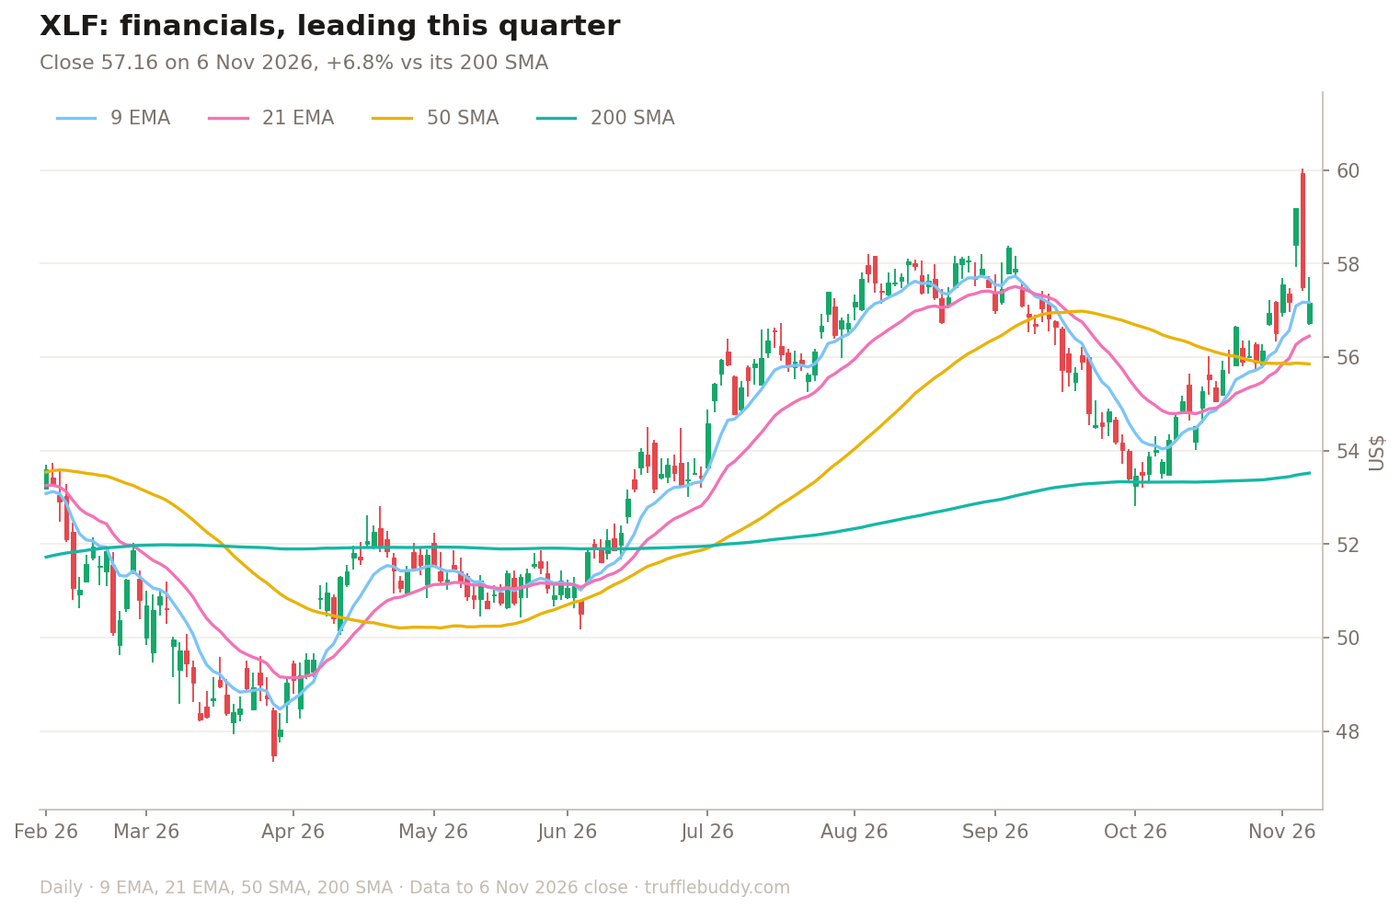
It is also worth noting that the XLV/SOXX and IGV/SOXX ratios show leadership moving away from semis this quarter. XLV/SOXX is up 52% this quarter, and IGV/SOXX is up 29%. A rising line means the first ETF is beating semis.
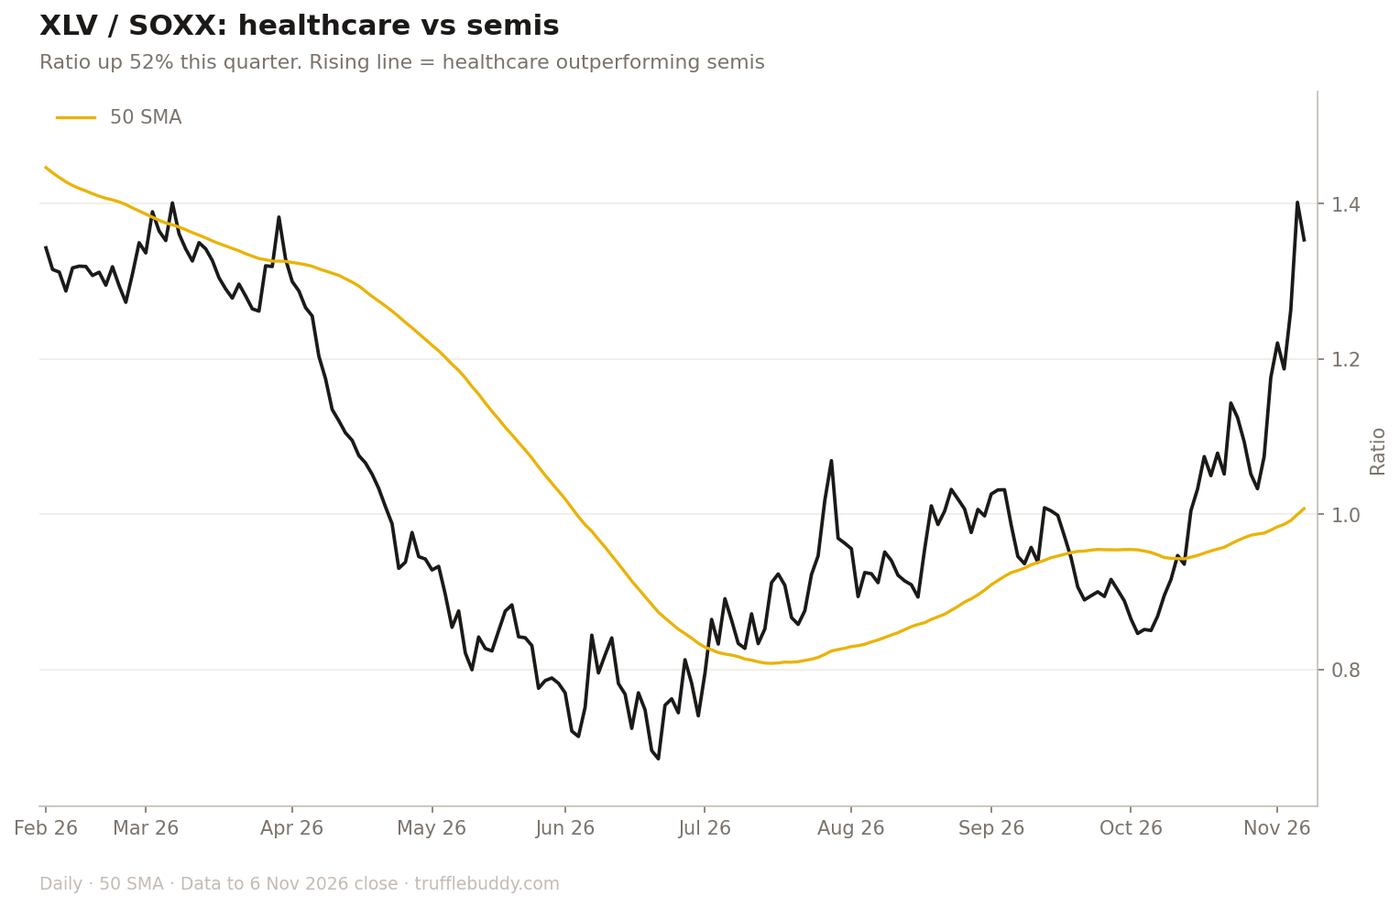
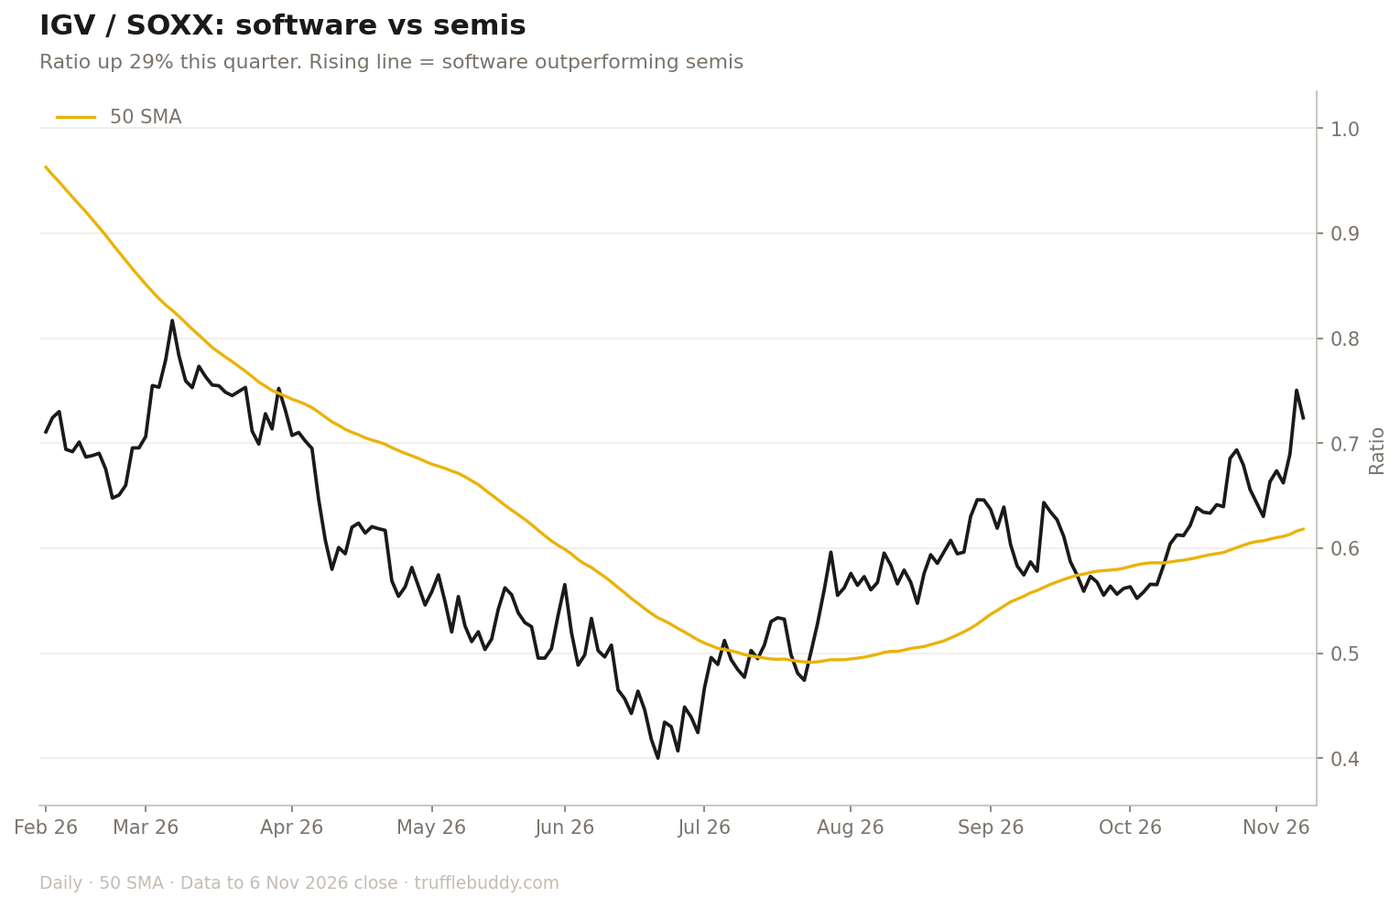
A lot of these flows look like long/short funds unwinding, or protective buying, rather than fresh conviction. Leadership also turns over fast: when we tested this on our own data, a sector's spell in the top three lasted a median of about two weeks, and XLV is already at four. That is why I am not treating the sector readings as a signal to buy a sector, and why I look at individual balance sheets instead.
QQQ has also broken its 200-day moving average. It first closed below it on 5 November, then Monday's rebound carried it straight back up to test it from below: a close of 679.35 against a 200-day of 680. Over the longer term, a break like this is usually where things start getting interesting for me.
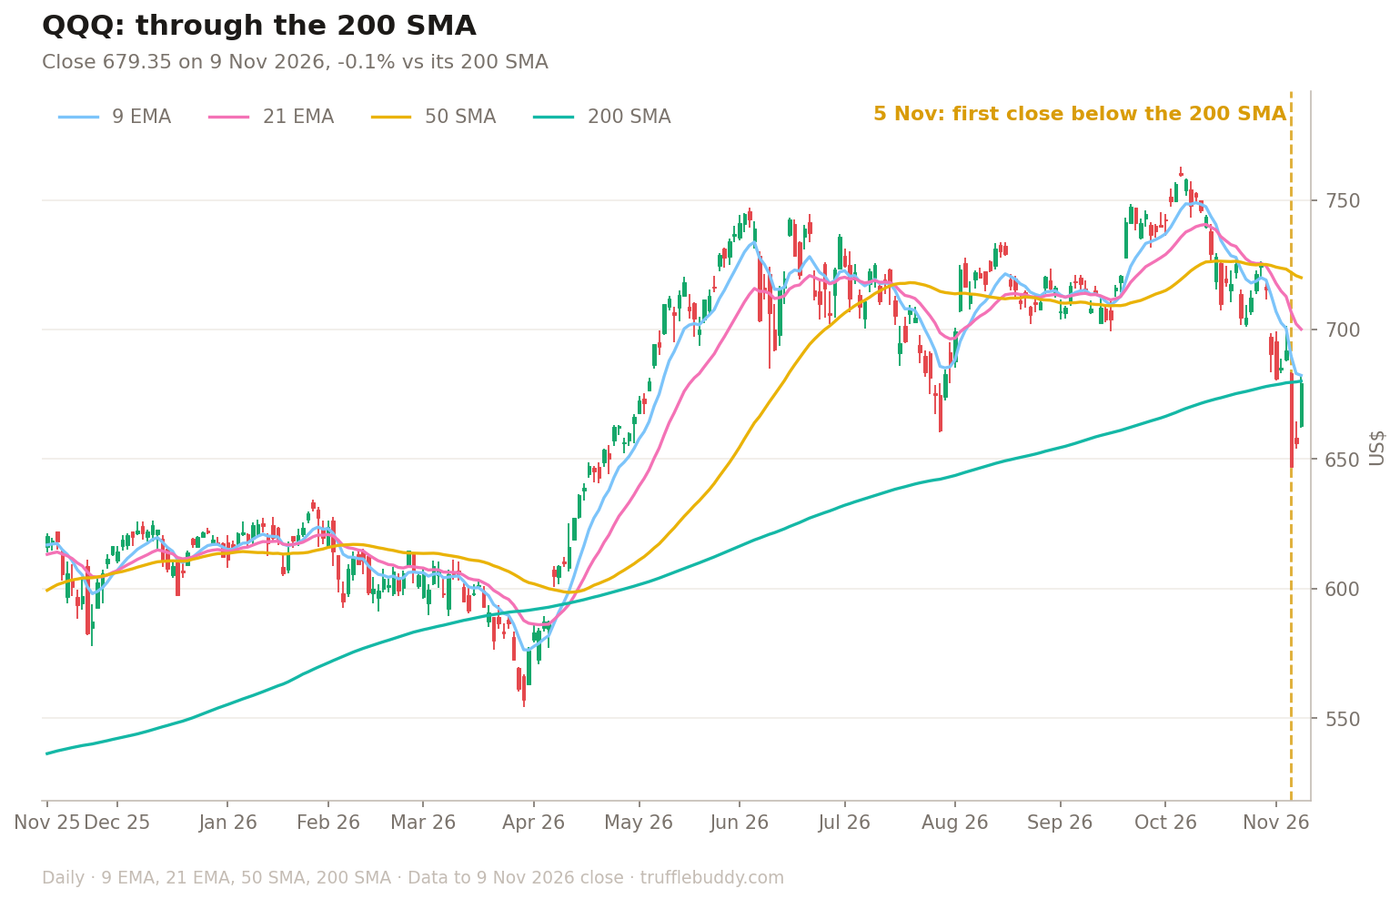
But the 2022 analog shows QQQ can stay under the 200-day for a long time: in 2022 it closed below it on 93% of trading days, including one unbroken stretch of 187 sessions. So laddering entries, or setting up clearly defined, cash-secured risk reversals, is what appeals to me here.
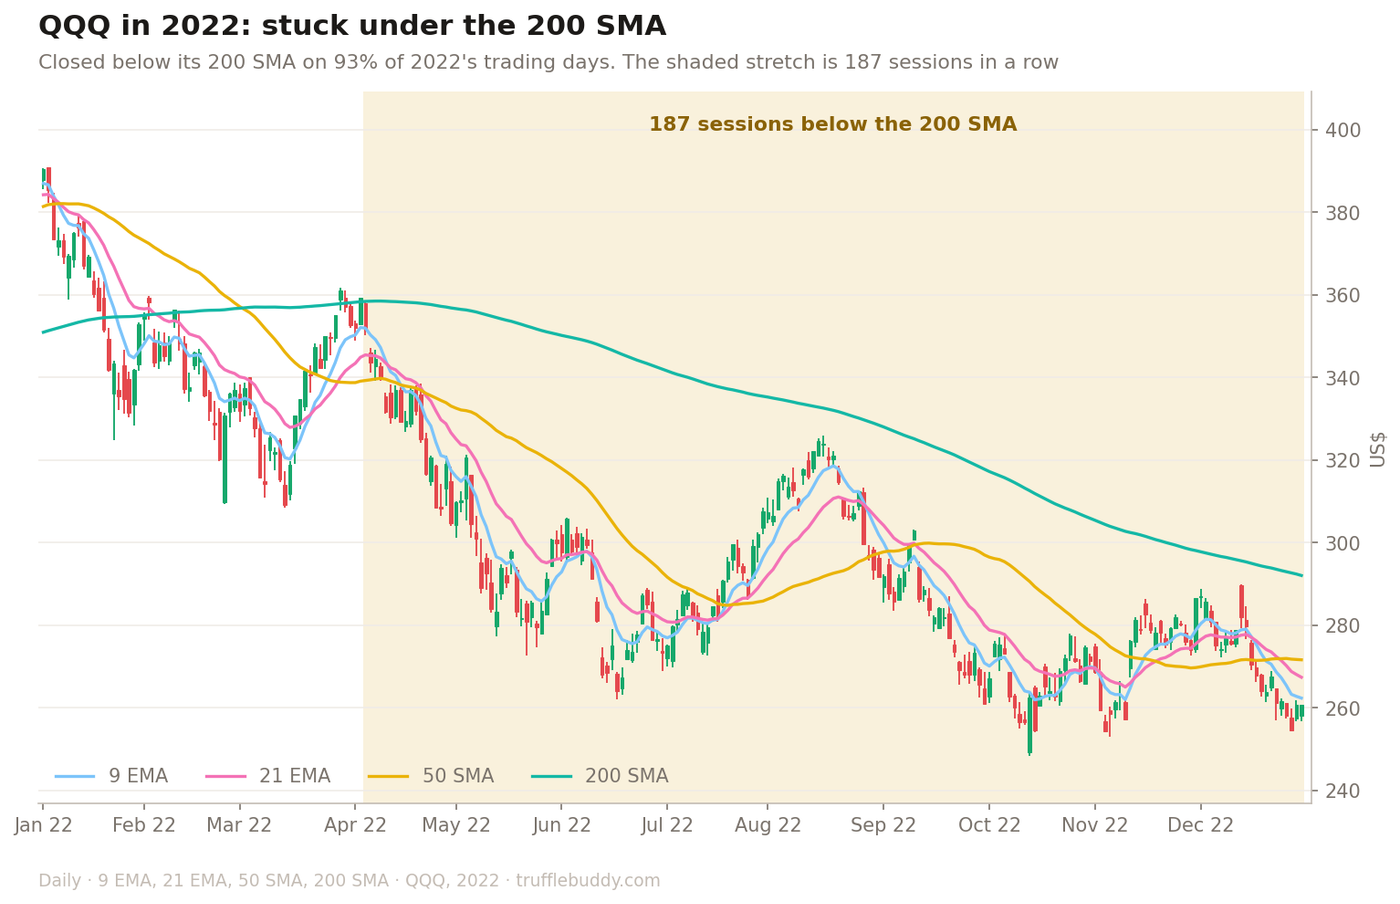
Violent unwinds like this have produced some of the best entries in hindsight. They have also kept falling for months after they looked cheap, as 2022 shows. So here is what I am doing, and why.
Plan 1: QQQ
I have not given up on tech and AI over the long run, but at this point picking a single winner is outright difficult. So QQQ is how I am holding that exposure.
I plan to ladder buy limit orders into QQQ and be patient. Timing the bottom will be close to impossible on this one, so I will rely mainly on historical support areas to DCA into. Markets will be choppy and fake-outs will be common, which is why I am being patient on my buys.
These are the three zones where I have my limit orders, shaded green on the chart. They are my levels, not a guide for anyone else, and QQQ can fall through all three: it fell 33% in 2022.
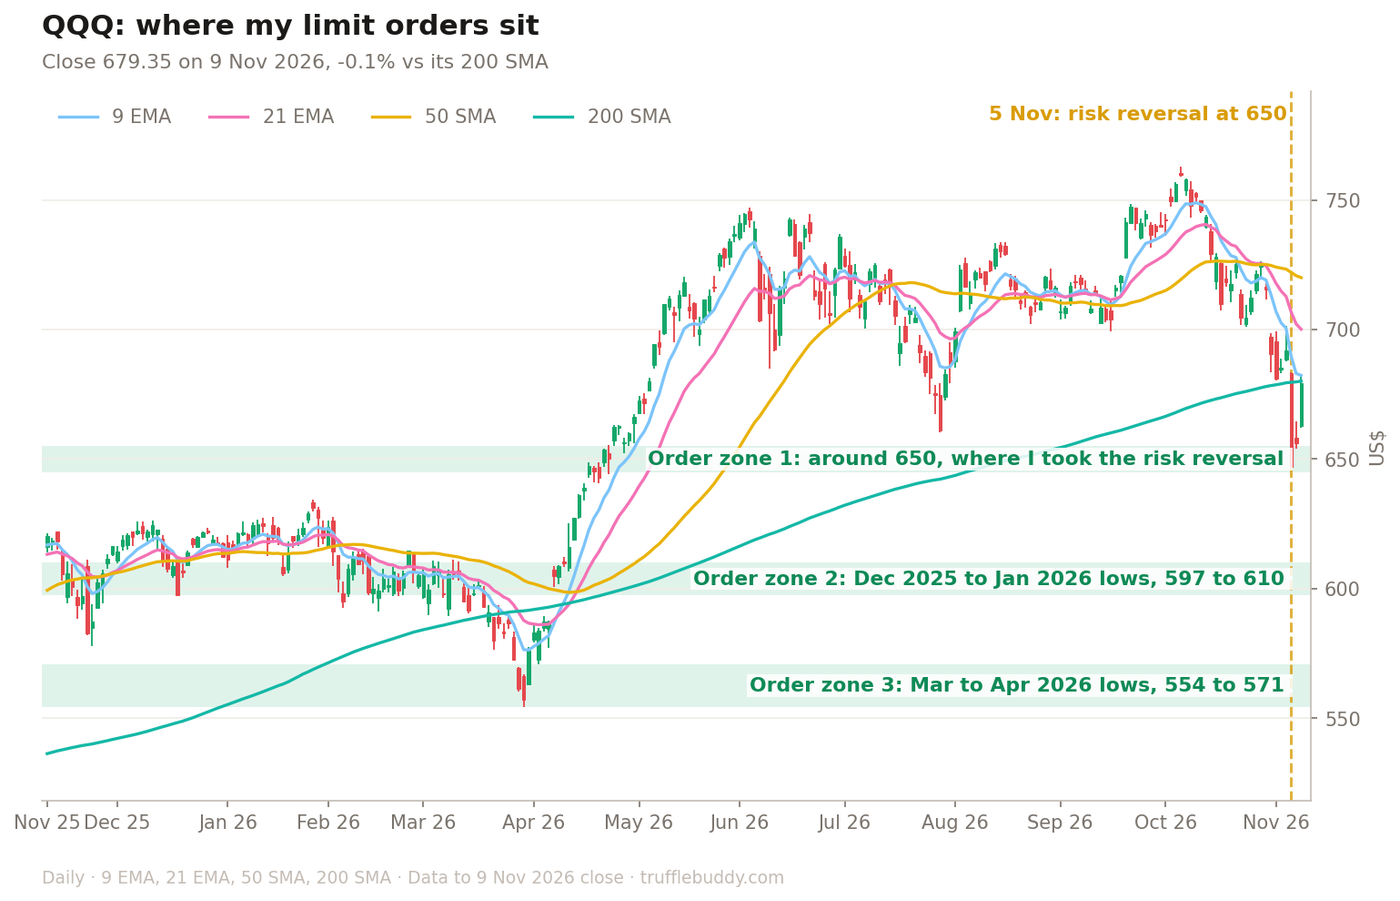
| Where my orders sit | QQQ price | Why I picked it |
|---|---|---|
| Order zone 1 | Around 650 | The 5 November capitulation low. It is where I opened the risk reversal below |
| Order zone 2 | 597 to 610 | The Dec 2025 and Jan 2026 lows. QQQ kept finding buyers around here from December to February, until March broke lower |
| Order zone 3 | 554 to 571 | The March and April 2026 lows, where the spring rebound started |
Above all three sits the 200-day moving average, around 680. It was support until 5 November. Now it is the line I am watching QQQ for, and Monday's close sat right on it.
The risk reversal below ties two of these zones together: I opened it in zone 1, and its put strike (600) sits in zone 2, right on the support. If QQQ falls into zone 2, I am happy to own it there either way.
Risk reversal
This is the trade that reflects the 2022 view most directly. A risk reversal here means I sell an out-of-the-money put and use that premium to buy an out-of-the-money call. It is a more complex, two-leg strategy that is meant for more experienced traders.
In a high-volatility market like this one, good skew is often available, because fear pushes put premiums up more than call premiums. If 2022's pattern repeats and a sharp rally comes, the call gives me upside. If QQQ chops sideways between my strikes, both legs can expire worthless and I have paid next to nothing. That is why this structure makes sense to me.
Here is the trade I took. On 5 November, with QQQ at about 650 during the sell-off and the VIX above 28, I opened:
| Leg | Strike | Expiry |
|---|---|---|
| Short put | 600 | 19 Mar 2027 |
| Long call | 710 | 19 Mar 2027 |
Net, I collected a credit of about $3.87, or $387 per contract.
On 6 November the put was priced at 30% implied volatility and the call at 24%. That gap is the skew at work: fear made the put expensive enough to pay for the whole call, with money left over. Premiums and skew change constantly, so treat my trade as an illustration, not a contract to copy.
Why 600 for the put. 600 is where I see support. It sits inside my order zone 2, the Dec 2025 and Jan 2026 lows. If QQQ gets there, it is a level I already want to own.
Important: this trade needs the cash behind it. The short put is a promise to buy 100 shares per contract at 600 if QQQ falls below it. If that happens, you are assigned and have to pay for the shares: $60,000 per contract (600 x 100). So I only do this cash-secured, with the full amount sitting in my account for as long as the trade is open.
I do not do it unsecured, meaning on margin without the cash. Selling the put on margin looks cheaper because the broker only asks for a deposit, but in a fast drop like 5 November that deposit requirement jumps, the broker can demand more money the same day, and if you cannot pay it they can close the position for you at the worst price. That is how a planned entry turns into a forced loss. Cash-secured, I avoid being forced out at the worst price, but the loss itself does not go away: I would own QQQ from about 596 after the credit, and it could keep falling from there.
What that means at expiry:
- Between 600 and 710: both legs expire worthless and I keep the $387.
- Above 710: the call pays $100 for every point QQQ rises past 710.
- Below 600: I own QQQ from about 596 after the credit.
- The worst case: if QQQ fell as hard as it did in 2022, about 33% from its October high to roughly 511, I would be down about $8,510 per contract, and the call would be worthless.
Where it stands now: I did not have to wait for expiry. The green line on the chart is the payoff in March. The dashed blue line is the position marked at Monday's close. QQQ rebounded to 679.35 on 9 November, right at its 200-day, and at Monday's option prices the trade is up about $1,765 per contract, four months before expiry. The call gained as QQQ rallied and the put lost value, so most of the payoff showed up early.
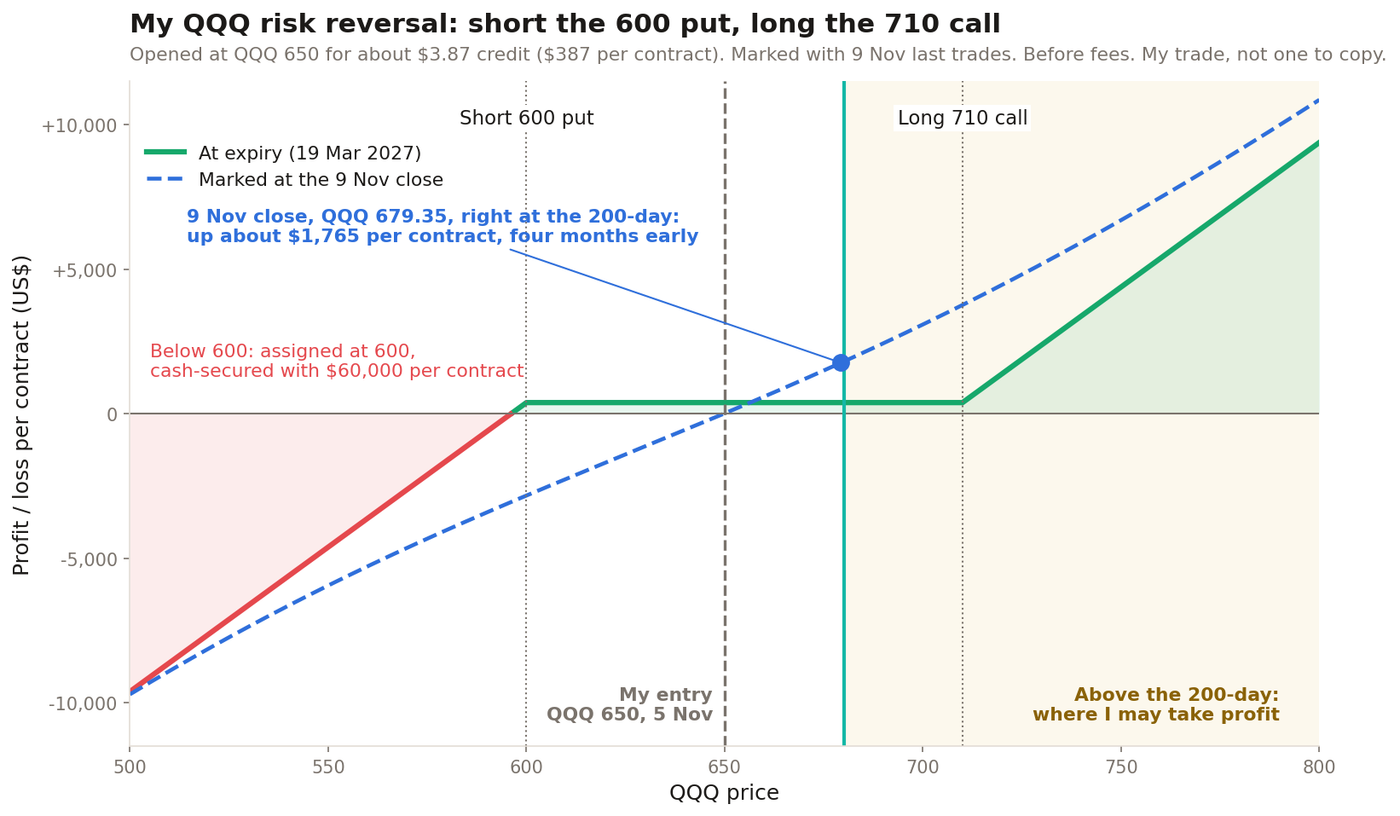
My exit plan. I might take profit if QQQ pushes through and above the 200-day. In 2022, both the March and August rallies stalled at or below the 200-day, so a move above it is where I would rather bank the gain than hold out for 710.
The same dashed line cuts the other way: had QQQ dropped toward 600 instead, the position would be showing a paper loss of around $2,800 per contract, even though at expiry the 600 level itself would cost me nothing. Being cash-secured is what lets me sit through that.
Would I open it again today? Not at these levels. The setup is not as clean after the rebound. The 600 put is now 12% below the market instead of 8%, so it pays far less ($13.37 on Monday, against about $21.70 when I opened), and the call costs more. Opening the same two legs today would cost about $1,378 per contract instead of paying me $387. If QQQ falls back toward 650 and the VIX spikes again, I might put the same trade on again.
Next, for members: the three single names I am looking at, straight from their filings, including a bank I started buying after an election crash, and how I am getting paid to wait on another.